
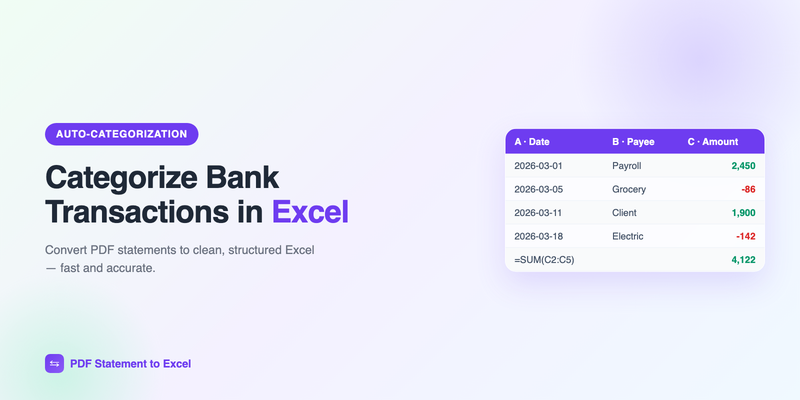
Getting your bank transactions into Excel is half the job. The other half is categorizing them — turning a raw list of dates and amounts into something that tells you where your money actually goes. Categorized transactions are what power a budget, a tax return, a profit-and-loss view, or a simple answer to "how much did I spend on software last quarter?"
This guide shows you how to categorize bank transactions in Excel, from a quick manual approach to a semi-automated system using formulas. No macros required.
Start here: you need your transactions in a spreadsheet first. If yours are still trapped in a PDF, convert them with a bank statement converter so you have clean Date, Description, and Amount columns to work with.
Step 1: Set up your columns
A good starting layout has these columns:
- Date — the transaction date.
- Description — the merchant or payee text from the statement.
- Amount — signed (negative for money out) or split into separate Money In / Money Out columns.
- Category — the column you'll fill in (Groceries, Software, Rent, Income, etc.).
Keep your list of categories short and consistent. Ten to fifteen well-chosen categories beat fifty overlapping ones. Decide them up front so your data stays comparable month to month.
Step 2: The manual method (small volumes)
If you have a few dozen transactions, just fill in the Category column by hand. To speed it up:
- Turn your range into a Table (Insert → Table) so filters and formulas extend automatically.
- Add Data Validation (Data → Data Validation → List) on the Category column so you pick from a dropdown instead of typing — this prevents "Groceries" vs "groceries" inconsistencies.
- Sort or filter by Description to categorize similar transactions in bulk.
Step 3: Auto-categorize with formulas (larger volumes)
Typing categories gets old fast. You can auto-assign them based on keywords in the Description. The idea: keep a small lookup table of keyword → category, then have a formula match each transaction's description against it.
Build a keyword lookup table
On a second sheet, make two columns — Keyword and Category:
| Keyword | Category |
|---|---|
| UBER | Transport |
| WHOLEFDS | Groceries |
| AWS | Software |
| PAYROLL | Income |
| RENT | Rent |
Match with a formula
In the Category column of your transactions, use a formula that checks whether any keyword appears in the description. A reliable pattern in modern Excel:
- XLOOKUP with wildcard search against the keyword list, or
- A SUMPRODUCT/ISNUMBER(SEARCH(...)) combination that returns the category of the first matching keyword.
For example, a formula can loop your keyword list and return the category whose keyword is found inside the transaction description, defaulting to "Uncategorized" when nothing matches. Anything left uncategorized is a signal to add a new keyword to your lookup table — so the system gets smarter every month.
Tip: keep an "Uncategorized" catch-all and filter for it after each import. Clearing that filter to zero is your sign the month is fully categorized.
Step 4: Summarize with a PivotTable
Once transactions are categorized, a PivotTable turns them into insight in seconds:
- Select your table and choose Insert → PivotTable.
- Put Category in Rows and Amount in Values (set to Sum).
- Add Date (grouped by month) to Columns to see spending by category over time.
Now you can answer real questions instantly: total spend per category, biggest expense areas, month-over-month trends, and income vs. outgoings.
Step 5: Keep it repeatable
The value compounds when you do this every month. To keep it fast:
- Reuse the same workbook and category list each month.
- Convert new statements to Excel and paste the rows under the last ones.
- Let the keyword formula categorize most transactions automatically; hand-fix the stragglers and add new keywords.
- Refresh the PivotTable to update every summary at once.
That's a lightweight personal-finance or bookkeeping system in a single spreadsheet. When your volume outgrows Excel, the same categorized data imports cleanly into accounting software — see our guides on using a bank statement converter for QuickBooks and importing transactions into Google Sheets.
Frequently Asked Questions
How do I categorize bank transactions in Excel?
Add a Category column next to your transactions, then fill it in — manually with a dropdown (Data Validation), or automatically with a keyword lookup table and a formula that matches each description to a category. Summarize with a PivotTable.
Can Excel categorize transactions automatically?
Yes, without macros. Keep a keyword-to-category lookup table and use XLOOKUP with wildcards, or SUMPRODUCT with ISNUMBER(SEARCH()), to assign categories based on words in each transaction's description.
How do I total spending by category?
Use a PivotTable: put Category in Rows and Amount (Sum) in Values. Add Date grouped by month to Columns to see category spending over time.
What if my transactions are still in a PDF?
Convert the PDF to Excel first so you have clean Date, Description, and Amount columns, then categorize. A bank statement converter does this in about two minutes.
Get clean transactions to categorize
Convert any PDF bank statement into clean Date, Description, and Amount columns — ready to categorize in Excel. Your first conversion is free.
Get Started Free